Exploring Explainable AI at Evovest
Everyone is now aware that machine learning models, also called AI models, have many uses in different fields. However, those models are like black boxes: the more complex the model, the more difficult it is to interpret. This creates a lack of transparency when you try to understand why the machine makes such decisions. Especially in the financial industry, there is an urge to understand the reasoning behind each decision.
With the constant development of new methods, gradually, more techniques are being examined and used in Explainable AI (XAI). We, at Evovest, also explored a few of those techniques, in hope that it will help us understand the decisions made by our models.
The main techniques that we discovered are Shapley Value, and LIME.
The Shapley Value was introduced in 1951 by Shapley, Lloyd S. [1], then implemented within Machine Learning by Scott M Lundberg and Su-In Lee [2] in 2017. We suggest the readings in reference, our brief comment on page 4 or a quick google search to get more acquainted with the concept.
Briefly, Shapley Value is the average expected marginal contribution of one feature towards the final prediction after all possible combinations have been considered.
LIME (Local interpretable model-agnostic explanations), which is a technique that approximates any black box machine learning model with a local, interpretable model to explain each individual prediction. It was developed by Marco Ribeiro in 2016 [3]. Due to the limitations of LIME, which can only produce local interpretations, we decided to delve into Shapley Value first and implement it into our investment process.
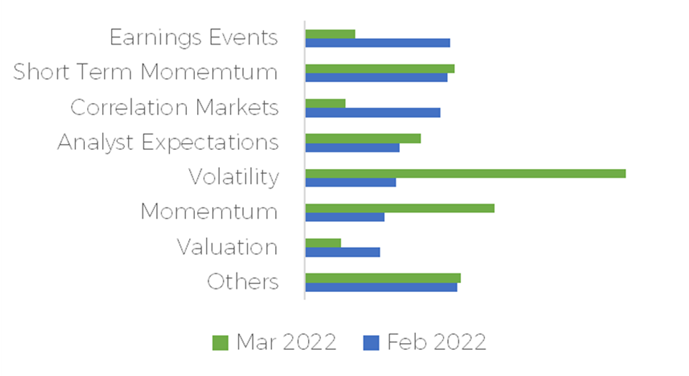
Here is an aggregation of our weekly Shapley explanation; they show us which category of features are contributing to the top 10% of our predictions for two different weeks.
On an individual level, with the help of Shapley value, it can also help us understand the decision of models on each stock, which means that we can understand why the machines suggest us to buy or sell certain stocks. We go over two examples in the next sections.
A concrete example with Ukraine invasion
 Adaptation to new market conditions is paramount to every portfolio managers. Here is a display of how our investment process adapted during the start of the Ukrainian invasion by Russia.
Compared to 2022-02-18, the major contribution for a high positive excess return (alpha) shifted from Earnings events to Volatility in 2022-03-11. We can read that on average, during the week of 2022-02-18, earnings events investment factors contributed to about 1.30% in alpha prediction, but was down to 0.40% during the week of 2022-03-11 for our highest expected alpha stocks.
The interpretation was that we were getting further from the majority of the earnings release events and getting shocked by the start of a global event that was increasingly putting pressure on certain segment of the financial markets, thus moving the aggregate explication from one category to the other.
This graph can give us a general idea of the weekly overall decision, global or by universe, and it can help us check if it is aligned with market news and trends.
A comparison of stock specific excess returns drivers
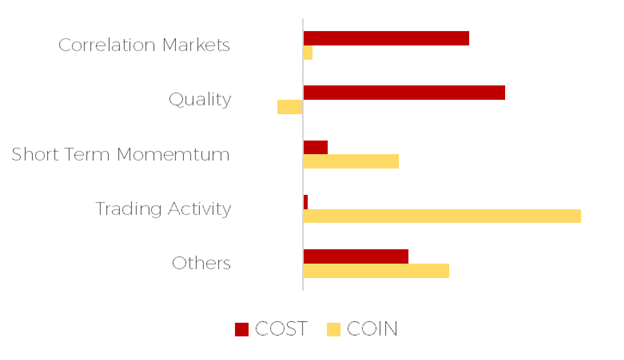
At the end of July 2022, our investment process predicted two very similar excess returns for the next week, but for two very different reasons. Without our explainable AI module, we would have told you that Coinbase and Costco had the same prediction of +1.15% excess returns for the following week. This answer lacks details and is difficult to relate to.
Even for us, we need more to understand to decision and use the feedback tool to improve and keep integration new notions within the investment process. The module gives us in depth insights into why the decision was made and also what contributed to the decision.
By breaking down the +1.15% for Coinbase and Costco, we can understand why the decision was made. The decision related to Coinbase was mainly due to abnormal trading activity and short-term momentum. The week after the prediction, Coinbase announced a partnership with Blackrock that sent the stocks significantly higher.
On the other hands, Costco was bought for its quality ratios and some favourable correlation with the markets conditions at the time.
We use this tool to explain what happens within the portfolio and to have a feedback loop inside the R&D process.
On a side note, the significant difference in drivers for a similar prediction is a diversification benefits when it comes to portfolio construction, and this is a reason why our process is not replicable by smart-beta exposure.
COIN vs. COST - Explainable AI - July 2022
A technical illustration of the process
The Shapley value is the average expected marginal contribution of one player after all possible combinations have been considered.
By taking a simplified approach using the Fama French factors, we can illustrate how we compute the Shapley value for the valuation factor with a specific stock. In the following case, we are using Apple inc. (AAPL).
The final step of our modelling process gives us an alpha prediction (excess returns over a benchmark), which we want more explanation about.
First, let’s decompose what it looks like:

Thereafter, we can rescale the equation by having a weight decomposition for each SHAP value:


Where the weights have the following relation:

We can repeat the steps described by the equation (2) and find the values behind the marginal contribution that can give us the insights on how our model decomposes the expected alpha.
We are able to use a Julia package called ShapML that implements the works described by Štrumbelj, E., Kononenko, I [4].
In summary, XAI methods allow us to understand our models, and enable us to improve our future work on features selection, reduction, and other feature engineering works.
We will continue exploring more methods progressively that can be adapted to interpret our models. In the meantime, we are advancing our investment process through other paths.
Reference
Lloyd S. Shapley. A value for n-person games, page 31–40. Cambridge University Press, 1988. doi: 10.1017/CBO9780511528446.003.
Scott M Lundberg and Su-In Lee. A unified approach to interpreting model predictions. In Advances in Neural Information Processing Systems, pages 4765–4774. NeurIPS, 2017
Ribeiro, Marco Tulio, Sameer Singh, and Carlos Guestrin. "Model-agnostic interpretability of machine learning." arXiv preprint arXiv:1606.05386 (2016).
Štrumbelj, E., Kononenko, I. Explaining prediction models and individual predictions with feature contributions. Knowl Inf Syst 41, 647–665 (2014).